The Politics of Measurement: Per Capita Waste and Previous Sewage Contamination
By Max Liboiron.
Measurements are never mere faithful representations of nature, but have social and political origins and ramifications. In representational theory, measurement is “the correlation of numbers with entities that are not numbers,” a process of transformation, translation, and even interpretation at the level of sampling and gathering data. What is selected for measurement and what is not, how measurements are standardized, what counts as an important unit of measure, and how measurements are used all have stakes for the systems of which they are part. This is as true in discard studies as it is other scientific and social scientific endeavors.
Per Capita waste measurements are a prime example. It is not uncommon to come across a statement like “Americans generate more waste than any other nation in the world with 4.5 pounds (2.04 kg) of municipal solid waste (MSW) per person per day.” Per capita waste statistics are created by dividing the total weight of waste by the population of a given area, and give the impression that individuals are the main agents of waste. This both reinforces the popular myth that humans are inherently wasteful, and that waste in general is synonymous with post-consumer waste. Neither is true.
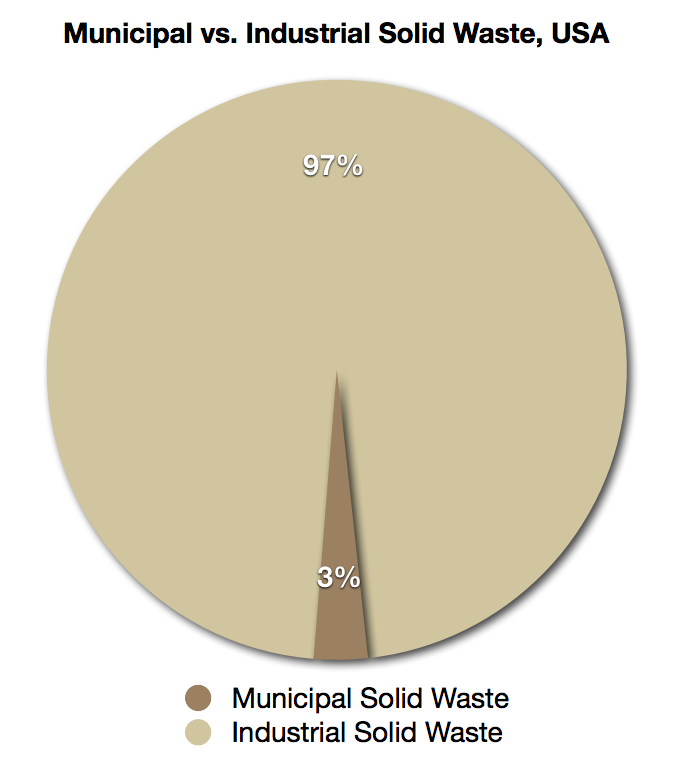
Chart by the author, based on figures from MacBride 2012, Royt 2007, EPA 1987.
The vast majority of waste in the United States, and most developed countries, is industrial solid waste. It has more tonnage, and is more toxic, than municipal solid waste by a wide margin (MacBride). Per capita measurements of trash obfuscates the main agent of waste– even within municipal solid waste, which can contain commercial and construction & demolition waste, I would argue that waste is industrial rather than individual. Try not to make any waste for a week. It is nearly impossible, even for people like Beth Terry who dedicates massive amounts of time, energy, and research to reducing what she throws away. Her effort is heroic– not wasting is outside of everyday processes and possibilities because our food system, ability to clothe ourselves, communicate, and socialize come wrapped. Changes in per capita waste is often a measure of packaging trends rather than the (im)moral inclination to waste. As historians of waste know, disposability and waste is an industry tactic for saturating markets (see Vance Packard for a contemporary perspective on this strategy, which began in earnest in the 1930s).
Thus, per capita measurements, by interpolating individuals as agents of waste, politicizes measurement in the interest of industry by reproducing the myth of the wasteful human rather than calling out how humans in our society have become an inextricable part of a an industrial infrastructure of disposables and waste.

This graph from environmentalleader.com shows how population, waste generated and per capita waste relate, but still implies that individuals in a population are the originators of waste.
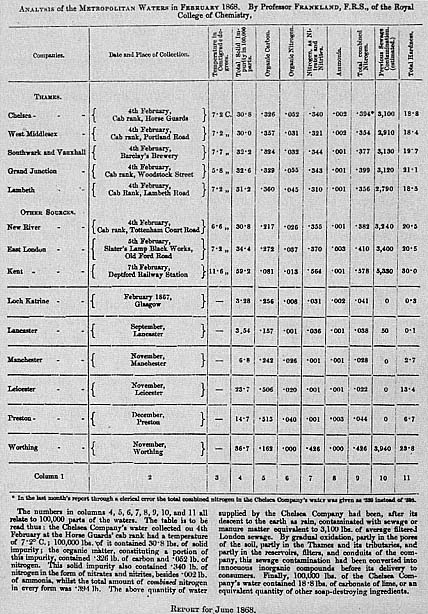
One of the first of Edward Frankland’s monthly analyses of London’s waters
done according to the format that the water companies found objectionable.
Especially troublesome were references to thousands of pounds of previous
sewage contamination
(Report on the Analysis of the waters supplied by the Metropolitan Water
Companies , p 49, 1872).
Previous Sewage Contamination (PSC) is a measure of waste that is self-consciously, willfully political. In the mid-nineteenth century, increased industrial activity and urbanization lead to the contamination of waterways used for public water supplies. Sewage, recently linked to several health epidemics, was of particular concern. Scientists were asked to determine whether a waterway was fit for consumption, but, in the professional opinion of Edward Frankland, a British water chemist for the Royal Institution, science was not always up to the task. Water analysis could not define the safety of water, chiefly because the presence and habits of germs, a new concept in the field, were largely unknown. Frankland believed germs could withstand filtration, chemical reagents, dilution, condensation, and other popular purification methods. Thus, even if a bacteriological test found no living germs in a sample, Frankland reasoned that a few germs may have survived purification and were just not present in the sample taken. These resilient germs could start an epidemic.
Thus, in 1867, Frankland introduced the concept of “previous sewage contamination,” or PSC, meant to represent the amount of sewage a river had received upstream. It was a number obtained by measuring the total amount of nitrogen compounds in a water sample, which in turn indicated the amount of organic material that had been in the water. This organic material could come from sewage or peat or other sources (science could not differentiate between them, and Frankland said the differentiation was “hygienically irrelevant”). PSC was meant to indicate whether there had ever been sewage in the water, and thus a potential health danger, regardless of whether the water had been purified.
In short, PSC was a metric used to advocate for a definition of safety that differed substantially from the status quo, which pushed for post-purification as the preferred technique of definition. Thus, PSC was an activist measurement. As a member of several Royal commissions on water quality, Frankland had the ability to instate PSC in water analysis reports received by Londoners. The idea was that citizens and other stakeholders would become disgusted, fearful, or enraged about the inevitable presence of “previous sewage contamination” in their water, and demand better water. Since PSC would be present in any purified source, as all local waterways were used as extensions of sewers and had other organic materials in them besides, “better water” would entail either changing the source of London’s water supply, or the legislated cessation of all sewage disposal into waterways. The latter was Frankland’s goal.
The reason to take measurements seriously is that quantitative work creates things. Per capita waste creates wasteful individuals and naturalizes an impotent course of action, while Previous Sewage Contamination creates pollution where before there was none. Activism is all about intervening in material conditions, and Franklin knew his judgement, expressed as a measurement, would be extrapolated off the page to make things happen in the world of things. Advocacy via measurement is not unique to activism–I would argue that per capita measurement is in the interest of industry, and it is not surprising to find that industry works to keep it as the measurement of choice in governance.
I believe that one of the unique abilities of scholars in the humanities and social sciences is to denaturalize such ontologies. Our job is to back up the truck and question the ground it stands on. In this case, we want to back construct the measurement to see where it came from and how the thing it purports to measure came to exist in the first place. This job is critical (in both senses of the term) because, as is evident from the examples, one of which is explicitly activist and the other which has high stakes for environmental action and blame, the quantification of characteristics into measurements has politics, and politics, to borrow Arjun Apparturi’s definition, is the set of relations, assumptions and contests pertaining to power.
Further reading:
Hamlin, Christopher. (1990) Edward Frankland: The Analyst as Activist
Law and Moser. (2006). Fluids or flows? Information and qualculation in medical practice
MacBride. (2012). Recycling Reconsidered
Star and Bowker. (1999). Sorting Things Out
Max Liboiron is a postdoctoral researcher with the Intel Science and Technology Center for Social Computing and the Superstorm Research Lab.
4 thoughts on “The Politics of Measurement: Per Capita Waste and Previous Sewage Contamination”
Comments are closed.

Another good discussion of this topic can be found in The Politics of Numbers by https://www.russellsage.org/publications/politics-numbers by William Alonso and Paul Starr.
Regarding the measurement of waste flows, the US EPA estimates waste generation by taking industry figures on production of goods, assigning product life times to the goods by category (durable, semi-durable and less than one year). As a result, aggregate numbers are very sensitive to products that are included/excluded in the model.
Thanks for the added reference! Muchly appreciated.
Hi, I was wondering where you got the figures for “Municipal vs Industrial Solid Waste in the United States” chart from?
Thanks for the question– I’ve updated the graphic and added the citation. The 97/3 split comes from an EPA report. MacBride’s chapter on “Toxicity and Tonnage” goes into detail about how the numbers came about, their shortcomings (mainly, there is an acute lack of access to ISW dump sites), and how they might be tweaked.